Welcome to your latest issue of Launch Conditions for the week ended July 9, 2021. Volatility perked up this week as equity shares came under pressure in this shortened week before a decisive rally on Friday.
The trading week was shortened to four days in observance of US Independence Day on Monday. The S&P 500 (+0.4%), Dow Jones Industrial Average (+0.2%), and Nasdaq Composite (+0.4%) eked out small gains and ended the week in record territory. The small-cap Russell 2000 struggled this week and declined 1.1%.
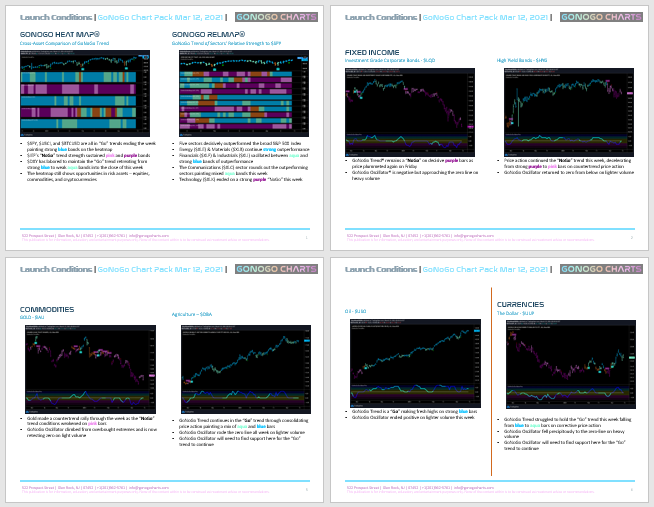
Click here to view your Weekly GoNoGo Launch Conditions Chart Pack 070921
Market Sectors Continue to Churn
The largest upside this week was found in long bonds. (Bond prices and yields move in opposite directions.) The US Treasury Bond 10-yr yield traded as low as 1.25% in part due to short-covering activity since many investors and economists had been calling for yields to go up and not down. The 10-yr yield ended the week at 1.36%, or seven basis points below last Friday’s settlement.
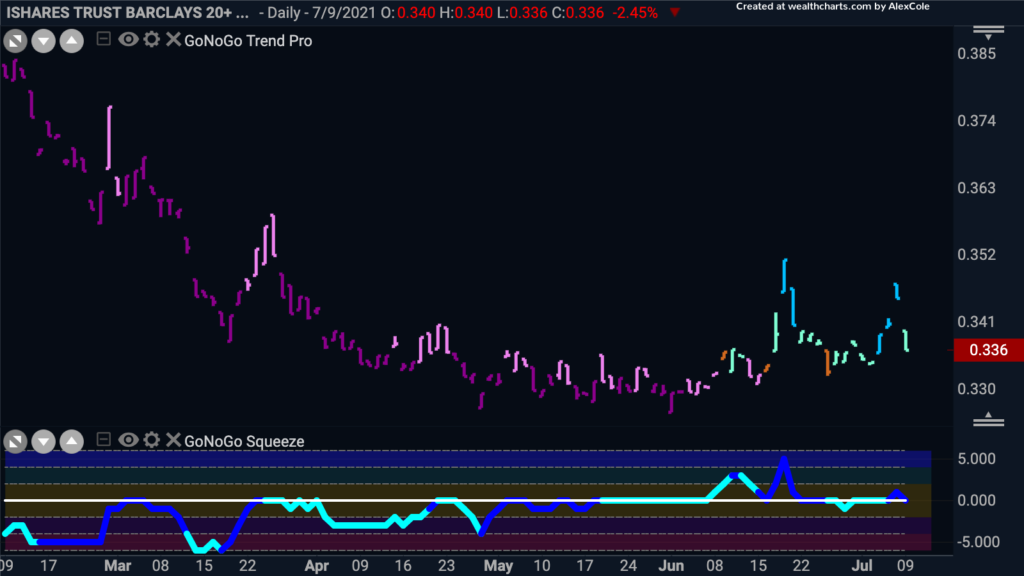
This is not what investors expect in a bullish risk-on environment. On a relative basis, treasuries have been in a nearly uninterrupted NoGo trend relative to equities since late April of 2020. See the chart of $TLT/SPY below which is showing the preference for treasuries to equities of late:
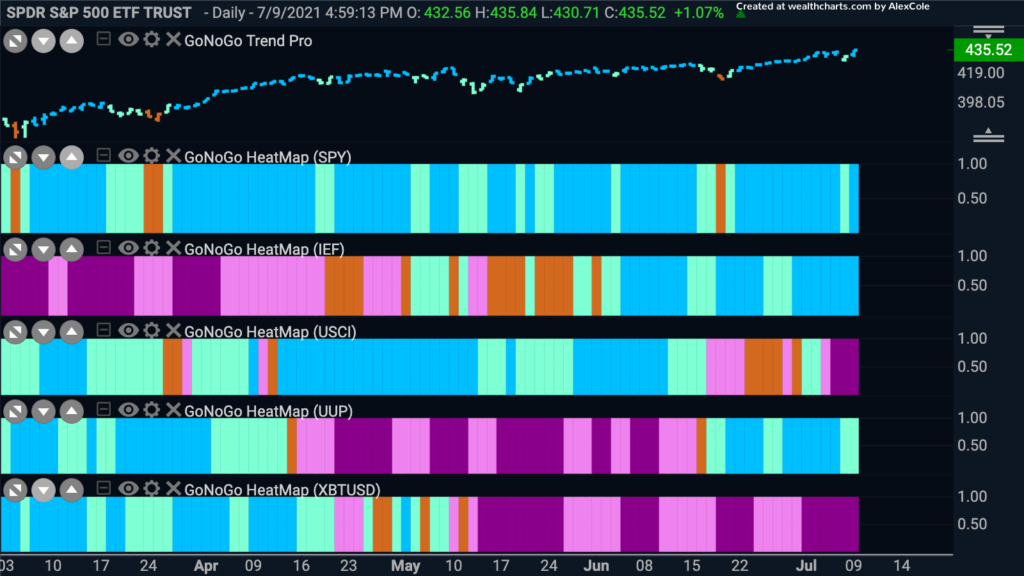
GoNoGo HeatMap – CrossAsset Trend Comparison
The GoNoGo Heatmap below compares the trend conditions of five major asset classes. The chart shows that equities ($SPY), treasury bond prices ($IEF), and the dollar ($UUP) are in “Go” trends. Commodities, after trendless choppy price action, appear to have entered a strong “NoGo” trend. Energy being the lone standout amongst falling commodities. Bitcoin remains in a “NoGo” this week and once again strengthened to paint strong purple bars as more scrutiny of Tether brings greater potential for regulatory intervention.
Mega-Cap Growth Leads Again
Within the equity space, the Nasdaq 100 outpaced the S&P 500 as the surging appetite for treasury bonds brought rates to a new low, giving additional slack in the stretched valuations of growth stocks. At the end of the sloppy week, the growth stocks stood atop the leaderboard while the value stocks lagged. Leaders in percentage gain this week were real estate, technology, healthcare, & utilities.
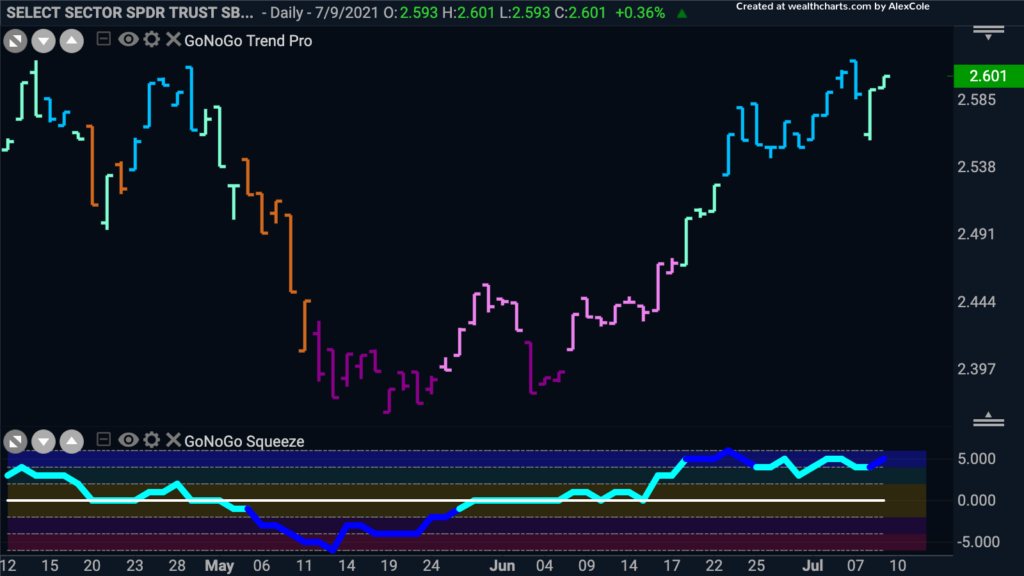
Bonds outpacing stock allocations is not generally considered bullish, but within the sector relationships, we can still find evidence of risk-on investor behavior. For example, the chart below of $XLY/ XLP shows stronger performance for the consumer discretionary sector over the consumer staples:
The rotation we’ve seen for several weeks now away from the industrial sectors back into growth stocks continued this week. See the GoNoGo RelMap below of the US equity sectors trend performance relative to the S&P 500 index:
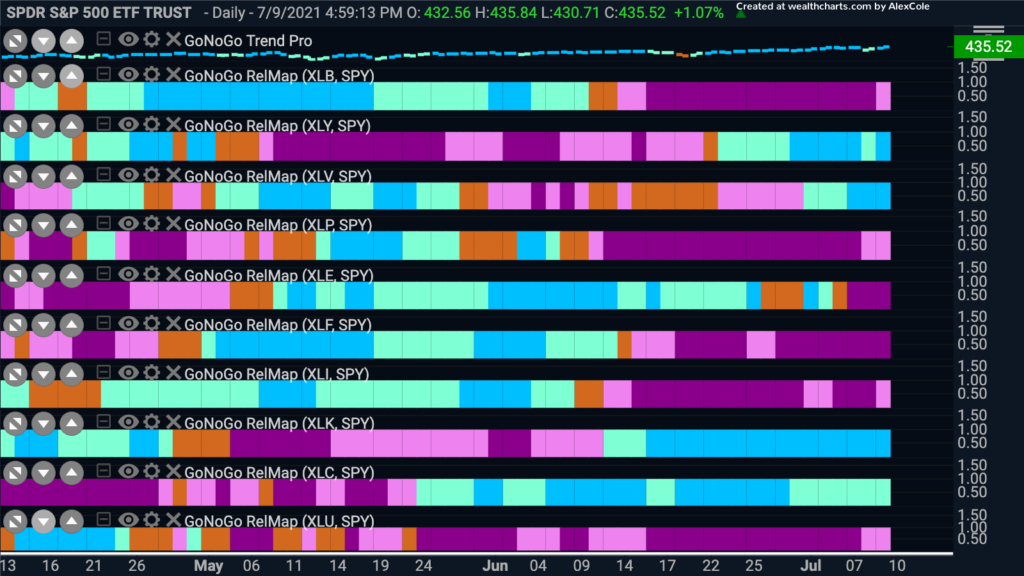
Falling Treasury yields provided a tailwind to equities early in the week, as falling bond yields typically improve the relative appeal of equities by implying a lower discount on future earnings and by making corporate dividends more attractive in comparison. But too much of a good thing shifted investor sentiment on Thursday, as worries over precipitous falling yields signaled expectations for slowing global growth. Industrials ($XLI), materials ($XLB), and even energy ($XLE) painting “NoGo” bars of their relative underperformance of the index in the chart above.
Such concerns seemed legitimate on Thursday after Japan extended its coronavirus state of emergency through Aug. 22 (barring spectators from the Olympics). At the same time, reports that the People’s Bank of China (PBOC) may cut the required reserve ratio for banks due to slower growth expectations hit the US headlines Thursday. The PBOC carried out a 50 bps cut to the reserve ratio on Friday.
Weakness for Banks
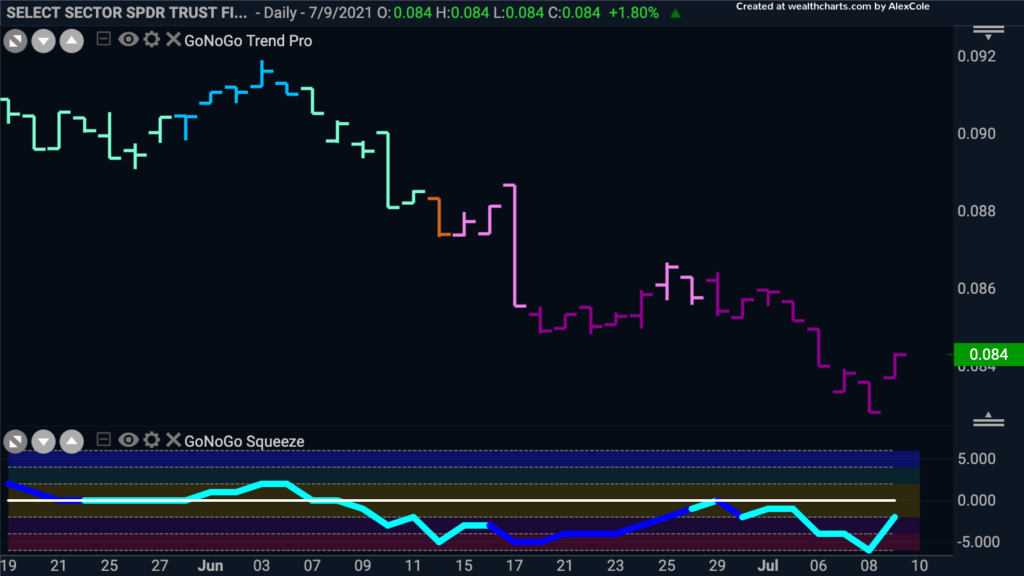
As we’ve discussed in prior notes, there is a meaningful correlation between banks and credit spreads. As rates dropped on the long end of the yield curve, the spread between what banks spend to borrow money and what they charge in lending fees contracted, thereby compressing their profitability. The $XLF was under severe pressure this week. Below is a chart of Financials relative to the S&P. Despite the late Friday rally into the close, $XLF is in a strong relative and absolute “NoGo.”
We look forward to seeing you all at the Wealth 365 Summit taking place this week. GoNoGo Charts will deliver educational insights on simplified technical analysis both Tuesday and Friday.
Register for FREE at https://summit.wealth365.com/gonogo


