No signs of a bear market

No signs of a bear market

4

January 2021

By

Tyler Wood

Cheers to a new year and another chance for us to get it right” 

– Oprah Winfrey

Welcome to the new year and your first weekly issue of Flight Path for 2021! Many investors evaluate their portfolio performance, their process and tools, and their goals for the year ahead with the start and end of the calendar year. Before launching into the first week of trading we should all take the time to understand what the landscape for investing is offering in terms of major market trends.

Each week, GoNoGo Charts subscribers receive a chart pack that provides a view of the trends across asset classes. Launch Conditions is designed to help readers maintain awareness of the longer-term landscape, no matter what their holding period or preferred asset class may be. At the close of each month, we provide a second edition of Launch Conditions for an even more expanded view of the long-term performance of various assets and indices.

Click into the chart packs below to give yourself context for how you want to be positioned going into 2021.

Open your Weekly Launch Conditions Chart Pack

Open your Monthly Chart Pack for Dec 2020

Take note of the technical picture across the major asset classes. The weight of the evidence is clear, major breakouts and all-time record highs across risk assets tell us we are in the early stages of a new bull market. Let’s start by looking at a GoNoGo Heatmap® of the major asset classes below.

GoNoGo Asset Class Heat Map Jan 4, 2021

The GoNoGo Heat Map® above shows us the daily trend performance of five asset classes: Equities, Bonds, Commodities, Currencies, and Digital Assets from the US perspective. The takeaway remains the same as it has been for several weeks: Equities, commodities, and the cryptocurrency markets are now in established “Go” trends.

Panel 1 – Global stocks continue in the “Go” trend now in place for several weeks.  $DGT tracks an equal-weighted index of 150 of the world’s most prominent companies as selected by Dow Jones.

Panel 2 – Government bonds, continue to paint “NoGo” bars, although they show weaker directional trend strength on pink bands. $IEF tracks a market-value-weighted index of debt issued by the US Treasury with 7-10 years to maturity remaining.

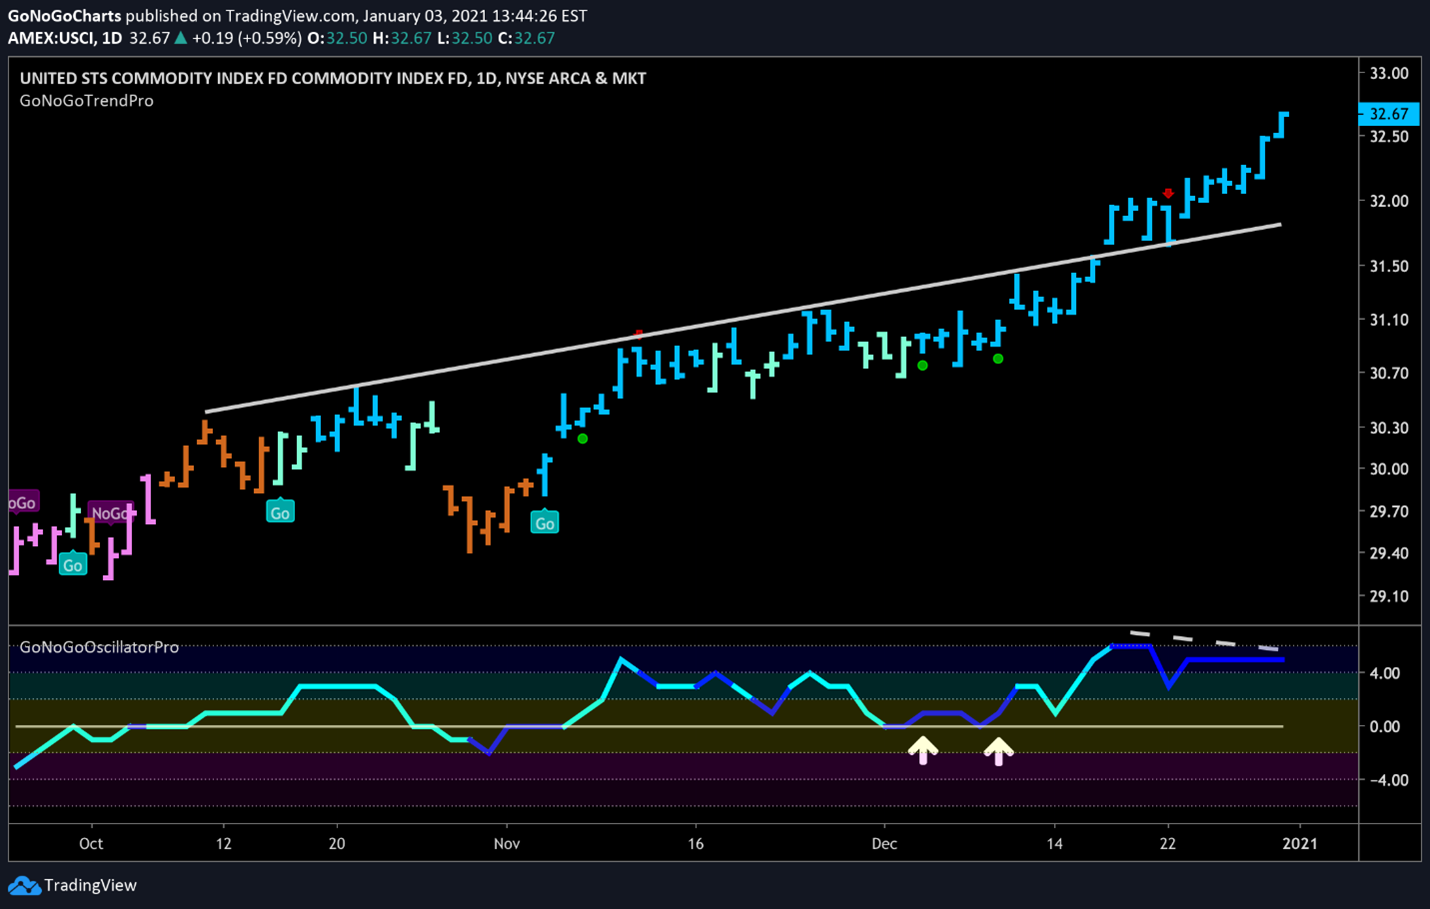
Panel 3 – Commodities are a “Go” continuing to paint strong blue bars.  $USCI tracks an equal-weighted index of 14 commodity futures contracts and holds at least one precious metal, industrial metal, energy, livestock, soft, and grain commodity.

Panel 4 – The US Dollar is now again in a persistent “NoGo” trend. $DXY is an index of the value of the United States Dollar relative to a basket of foreign currencies.

Panel 5 – Bitcoin continues in a “Go” trend and we saw continued strength this week as price climbed daily to new all-time highs.

EQUITY EXCELLENCE

The GoNoGo chart below shows daily prices of the S&P 500 ETF, $SPY.  As we saw from the heat map above, the global trend for equities is a strong “Go” and this is the case here as well.  In November we saw several “Go Fish” bars as price struggled with the volatility that prevailed this autumn.  However, after never dipping into a “NoGo” color, a new “Go” was flagged and the climb has been steady since. GoNoGo Charts triggered several green low-risk entry icons after each pullback as the trend remained strong.

Gains have been more tempered over the last several weeks though and we will look for support at the lower bound of the upward sloping trend channel. Technical analysis literature tells us that as support is tested, GoNoGo Oscillator’s interaction with the zero line will confirm or diverge from the price trend. The dance between the two indicators affords an early signal of whether the trend will continue each time.


$SPY S&P 500 Daily GoNoGo Trend

For many reasons, the world needs 2021 to be a different year, and we know it will be. New leadership in the U.S. and the resolution of Brexit alongside the rollout of vaccinations around the globe and technological advances at every turn will likely shape global markets throughout the year.  For the risk-averse investor in all of us, let’s take a look at defensive securities that were safe-haven assets in Feb and March 2020. For now, the charts look like the glide path of a brick, but if this is not the start of a new secular bull market for equities, we will see signs of fresh “Go” trends in these assets.

TREASURIES HAVE TANKED

As equities have been a “Go”, treasury prices have unsurprisingly painted “NoGo” bars since early October. The weight of the evidence suggests the path of least resistance is lower on an absolute basis. On a relative basis, investors holding government bonds have missed out on a myriad of incredible returns. Small Caps delivered 31% gains in the final quarter. The NASDAQ was up 44% for the year, despite the massive plunge in February. Bitcoin roughly quadrupled in 2020 (and at the time of publication we are seeing some profit-taking)!

Interestingly, the bulls and the bears have been wrestling over the past month as sellers are driving prices lower (reflected in the chart below of $IEF by lower highs) and yet buyers are back-stopping the selloff  (reflected in the chart by higher lows).  During this potential basing of price action, GoNoGo Oscillator has consistently been holding the zero line. Until that coiling of momentum breaks out, we patiently await the outcome.

The most recent daily closing price bar appears to challenge the downward sloping trendline of lower highs.  If the GoNoGo Oscillator is able to break sharply into positive territory, we could begin to make the case for a base in Treasuries and have a realistic discussion about the markets shifting back to defensive assets. For now, we want to find high performing opportunities elsewhere.

$IEF US Treasuries Daily GoNoGo Trend Jan 3, 2021

CATCHING COMMODITIES

The GoNoGo chart displayed below reflects daily USCI commodity index fund prices.  The chart shows strength in the trend for commodities. The interaction of GoNoGo Oscillator and the zero line provided several green low-risk entry signals as the trend gained momentum in December.

As we are dedicating much of this issue of Flight Path to spotting risk on the horizon, there are a few elements suggesting $USCI may be a bit overextended. The “Go” trend has steepened in recent weeks on heavy volume – reflected by the dark blue color of the oscillator.  The concept of polarity suggests that the upward sloping trend line that used to be resistance, will now act as support for prices of $USCI.  As price moves further away from this support line, we have a higher risk assessment for this security. These are not suggestions that the trend is weakened, but merely that adding capital to this position now has a lower risk-reward ratio.

In addition, we have highlighted a very slight oscillator divergence in the lower panel. If price corrects in the short-term as traders take profits from recent gains, we would look for the oscillator to fall to zero as price approaches trend-line support. If the oscillator is then supported by the zero-line, we would potentially receive another low-risk entry icon and have a great opportunity to add to the position.


USCI Commodities Daily GoNoGo Trend Jan 3, 2021

DOLLAR DOLDRUMS

Speaking of assets with the glide path of a brick, the dollar re-entered a strong “NoGo” trend at the end of October and quickly made a succession of lower highs and lows. Since the last “NoGo” was flagged, GoNoGo Oscillator has remained below zero. The logic is clear, investors are not raising cash as equities are breaking out to new all-time highs. In fact, GoNoGo Charts research has written for months about the weaker US Dollar providing tailwinds to trends in Emerging Markets, Commodities, cyclical sectors, and large net US exporters.

If the bull market in equities were threatened, we would see investors raising cash, and demand for US Dollars driving the $DXY higher. This “NoGo” trend is firmly in place, but we have highlighted a few elements to watch as early warning signs. The bullish divergence between price and the GoNoGo Oscillator highlights that price made a lower low as the oscillator set a higher low. Subsequently, we would look to see GoNoGo Oscillator test the zero-line from below. The most likely outcome is that the oscillator will be turned away at zero, leading to further price declines. If GoNoGo Oscillator were able to break into positive territory, then we would watch price closely for confirmation of upward trending price action. Given the weight of the evidence, there are many contradictions of this current chart needed for $DXY to escape the quagmires of its “NoGo” trend.


DXY Dollar Index Daily GoNoGo Trend Jan 3, 2021

“GOLD”ilocks 

For some assets, conditions are never quite good enough to sustain a “Go” trend. Gold is of course the most heavily traded precious metal and has long served as a hedge against inflation and equity risk. Therefore, if the bull market in equities is under pressure, we should see outperformance in gold on a relative basis.

Below is the weekly GoNoGo Chart of $IAU, the Ishares Gold Trust ETF.  As you can see, there was a strong counter-trend correction in the last quarter of 2020. GoNoGo Oscillator even failed to find support at the zero-line as the signs of weakness stacked up against this “Go” trend.

However, in recent weeks price is climbing to make its first foray outside of the downward sloping trend channel that we were able to draw from the high this past summer. For those worried about inflation, or those looking to capture short-term performance in gold, we would like to see the oscillator break back into positive territory to confirm this price action.


IAU Gold Weekly GoNoGo Trend Jan 3, 2021

Looking at the daily chart of the same Gold Trust, we can see that GoNoGo Trend has largely painted the pink and purple bars of a “NoGo” for Gold since the trend was flagged in September. Price is trying for a second time to break free of the downward “NoGo” trend. Most recently, GoNoGo Trend signaled the strongest trend conditions, painting the blue color in the first few bars of the new “Go” that was flagged at the very end of the year.

There is another indication that this breakout may be more powerful than the short-lived “Go” that was flagged in November.  GoNoGo Oscillator quickly retested the zero-line after breaking out to positive territory and this time, the oscillator found support.

IAU Gold ETF Daily GoNoGo Trend Jan 3, 2021

BYE BYE BITCOIN

There may be no clearer sign for the bullish behavior of investors than the incredible appetite for cryptocurrencies that we saw in 2020. We have focused on the world’s largest digital asset in several recent Flight Path newsletters as the entire field of digital assets is worthy of analysis even though cryptocurrencies are still in their infancy as a store of value.

The “Go” trend pictured in the chart below sustained a price move from just under $11,000 to nearly $35,000.  Along the way, GoNoGo Oscillator remained above the zero-line as it should when a trend is healthy.  The consolidation we saw in late November and early December gave investors an opportunity to enter this trade (or increase the position) in the form of green low-risk entry icons.

At the time of writing this research, price had rocketed away again, with the GoNoGo Oscillator sustaining very positive readings on heavy volume.  Now that investors are taking profits, we will look for GoNoGo Oscillator to find support at the zero line for the trend to continue.


BTCUSD Bitcoin Daily GoNoGo Trend Jan 3, 2021

Whatever your process as an investor or trader, we encourage you to maintain an objective view. Look at the weight of the evidence and position your portfolio according to what the market is telling us. GoNoGo Charts were designed over years to blend a complete set of technical information into a clear and concise single picture that never obscures the most important indicator of all Price!

Tags:

$btcusd $DXY $IAU $IEF $SPY Gold GoNoGo Heat Map GoNoGo Oscillator GoNoGo Trend GoTrends risk assets US Treasuries

get in touch

Mon - Fri 8:00 - 16:00
Subscription Form
research
$1.99 / week
Trend Analysis and Charts Delivered Weekly
Flight Path
Pre-Market Monday Morning
Launch Conditions
Delivered Every Saturday Morning
Research Chart Pack
16 GoNoGo Charts Included with Every Report
Premium
$9.99 / week
Daily Research
Flight Path
Pre-Market Monday Morning
Launch Conditions
First Thing Saturday Morning
Daily Blast Off
Pre Market Daily
add-ons
Deploy GoNoGo Indicators on Your Favorite Platforms