Uptrends, breakouts, calm credit markets, “Meme stocks” and strong market breadth… this is still a bull market
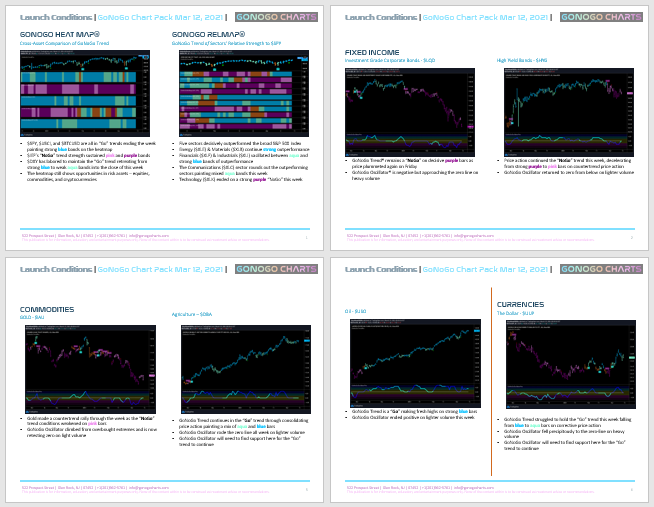
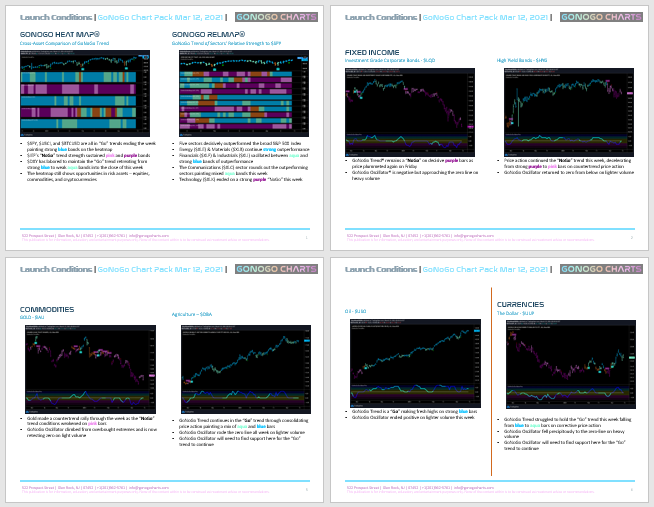
The shortened trading week for US markets brought modest gains across broad US equity indices. The Dow rose 0.7%, the S&P 500 gained 0.6% and the Nasdaq Composite ended positively by 0.5%. Flip through your weekly Launch Conditions chart pack below to see trends across major asset classes:
GoNoGo LC 060621
Energy shares performed best within the S&P 500 Index as oil prices reached their highest level since mid-Oct 2018. WTI crude oil rose $0.81 to $69.62 per barrel which led the energy sector higher by 6.7% for the week. Year to date, the energy sector has delivered a 45.3% return, against roughly 12% for the S&P, and only a 6% return from the technology sector.
Treasuries rose to apply downside pressure on yields easing constraint on growth sectors’ stretched valuations and allowing them to regain lost ground on Friday. Technology and communication services gained a respective 1.2% and 0.6% for the week while the consumer discretionary sector lost 1.0% under the weight of Tesla’s decline.
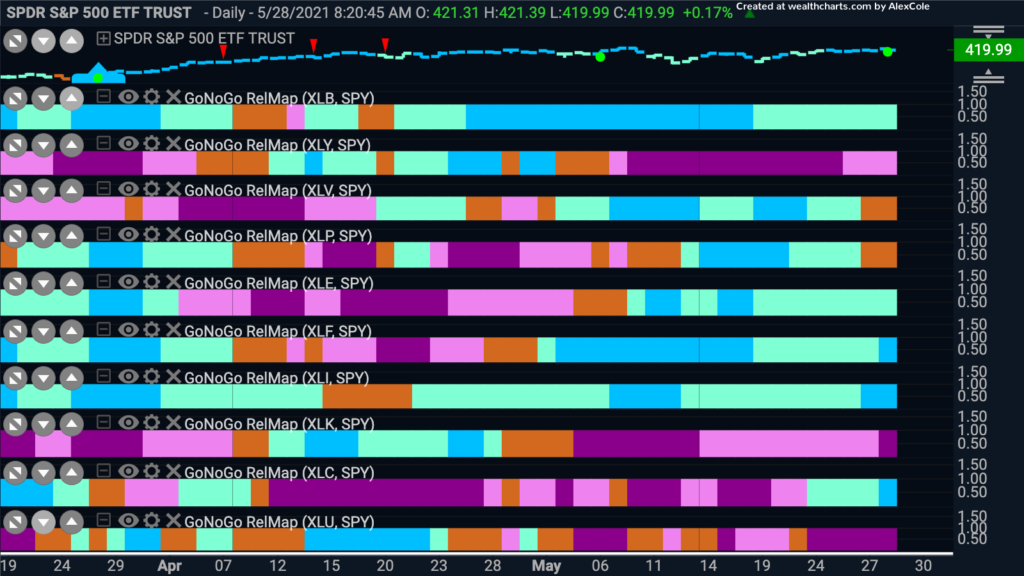
See the GoNoGo RelMap below of the S&P Sectors as they performed relative to the benchmark index – remember, Blue & Aqua are leaders, Pink and Purple are laggards.

Cryptocurrencies remained in the headlines this week while 2021’s “meme” stocks renewed their headline status with extreme volatility. AMC Theatres $AMC surged 95.2% on Wednesday and gained 83.4% for the week, while GameStop $GME and Bed Bath & Beyond $BBBY gained 11.9% and 13.3% respectively. A thoughtful post from Larry McDonald this week helps put a human perspective around the formation of resistance levels and selling pressure as securities retest former highs:
It took Google nearly 24 years to reach a $1T market cap, $XBT just twelve years with the last $500B of gains this year. What does that mean? The beast inside the market is telling us there is a lot of capital that owns Bitcoin at MUCH higher prices. There is a substantial amount of weak hands in XBT that thirsts every minute of every day this week, “to get even and get out.” – Lawrence McDonald, TheBearTrapsReport
Elsewhere, the Bloomberg gold spot price rose $20.76 to $1,891.51 per ounce adding to the upside thesis for the precious metal and the recent relative outperformance against US equities.
Finally, the Dollar Index declined 0.4% to 90.12 providing further tailwinds to the commodities rally and the extension of the bull market to major indices around the world including Brasil, Russia, India, South Korea, and other emerging markets. Market sentiment is heating up domestically, but that’s B.R.I.SK baby!
We hope you find value in your weekly issue of Launch Conditions from GoNoGo Research. Please take a moment to step back from the headlines and simply review the trends across major asset classes.


