Down to $30,000, back up over $38,000, back down to $33,000. That is the wild ride that is investing in Bitcoin. It seems as though a single tweet from Elon Musk can rock the entire digital asset class, whether it is pumping up Dogecoin or letting down Bitcoin. Perhaps Bitcoin is here to stay though as buyers showed their hand as the world’s largest cryptocurrency found support at prior lows right around $30,000. The other markets continued to trade also, and we see several major themes continue.
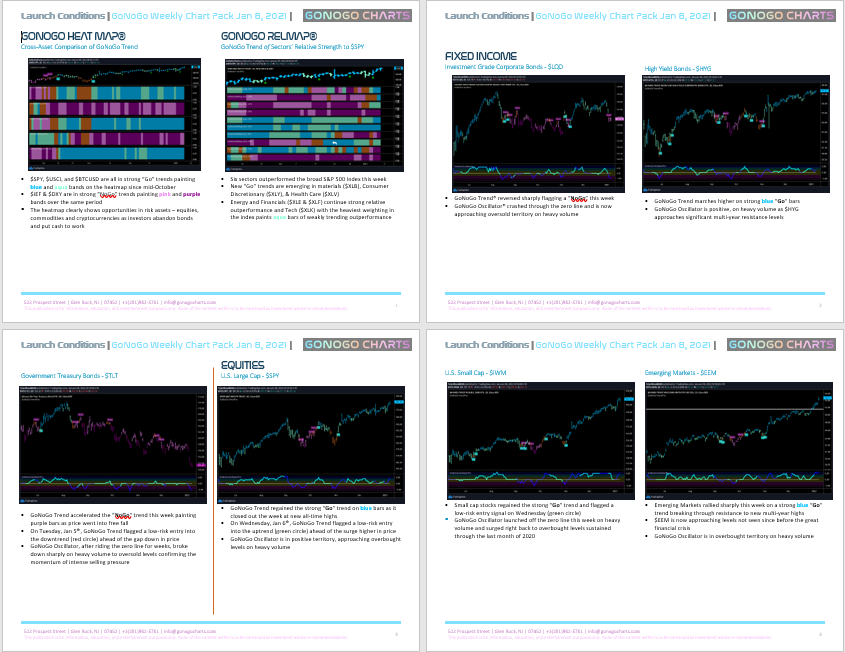
This weekend, spend some time flipping through your Launch Conditions Chart Pack for the week ending May 14 and reacquaint yourself with the longer-term perspective Charles Dow favored so highly.
Crashing Crypto
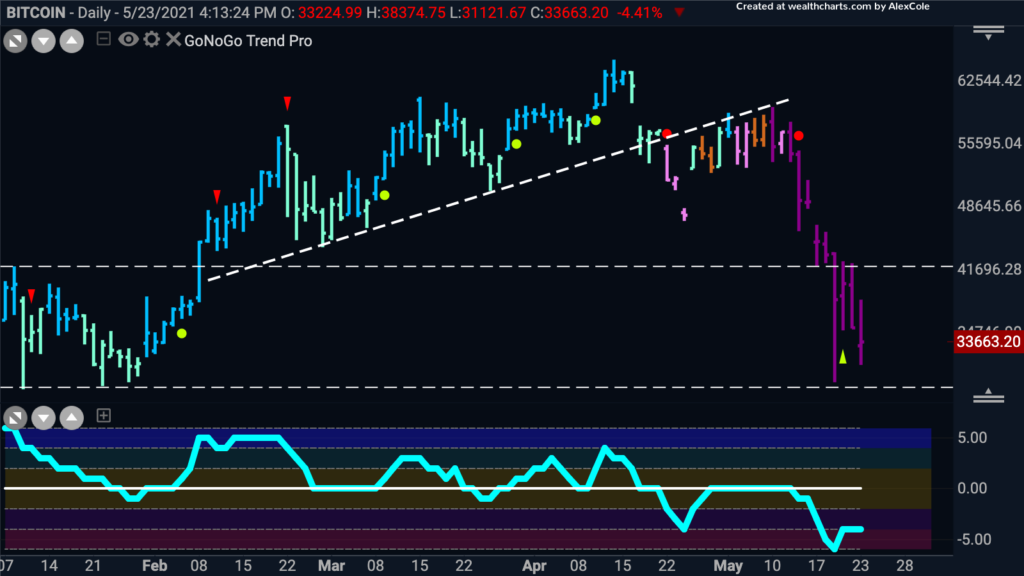
The chart below shows the GoNoGo chart of Bitcoin. It is interesting to note the support and resistance levels being respected so clearly by traders. Buyers at the lows from earlier this year as well as sellers those prior highs. We also saw how the trend line, once broken, became resistance and we saw the GoNoGo Trend roll through its colors.

Equities and Commodities continue in “Go” trends
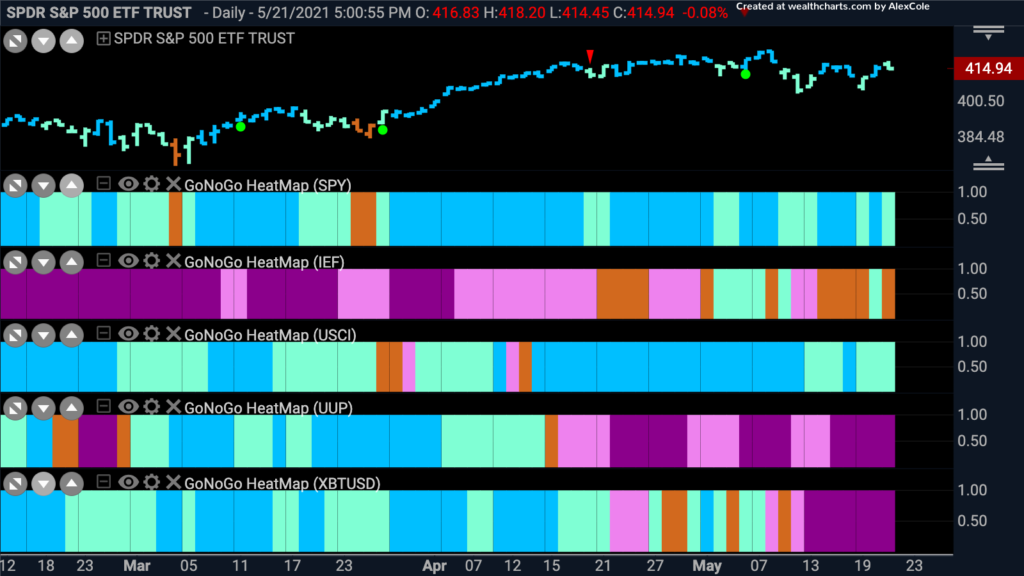
The GoNoGo Asset Map below shows the risk on environment persists. Equities and commodities are in “Go” trends, while the dollar and treasuries continue to struggle. We are seeing some amber bars threaten the trend in treasuries again so we will watch this closely, especially as equities and commodities show some weakness with aqua bars.

Flip Through Your Weekly GoNoGo Launch Conditions Chart Pack Here:GoNoGo LC 052321


