After choppy trading, the markets rallied back to new highs this week
Across the board, equities pushed higher this week, lifting most of the major benchmarks to new records. The small-cap Russell 2000 Index outperformed and extended its recent market leadership, ending the week up 7.3%. These strong gains for the Russell resulted in roughly 19% returns year to date. The Dow Jones Industrial Average set intraday record highs every day this week, ultimately rising 4.1% and closing at a record high. The S&P 500 set new highs for the first time in a month gaining 2.6%this week while the Nasdaq Composite dug itself out of correction territory with a little more than 3% gain.
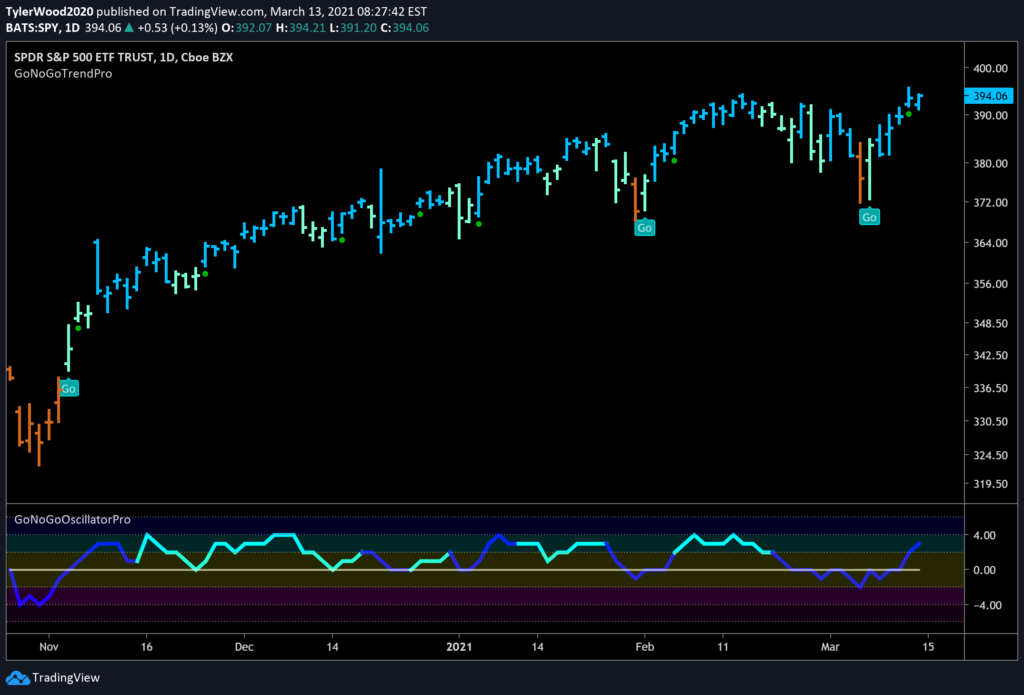
See the daily GoNoGo Trend® chart of the S&P 500 below:

The S&P 500 returned to a strong “Go” painting blue bars through the week and posted a low-risk entry icon on Thursday. GoNoGo Oscillator climbed on heavy volume back to positive territory. This momentum helped $SPY to end the week at fresh all-time highs.
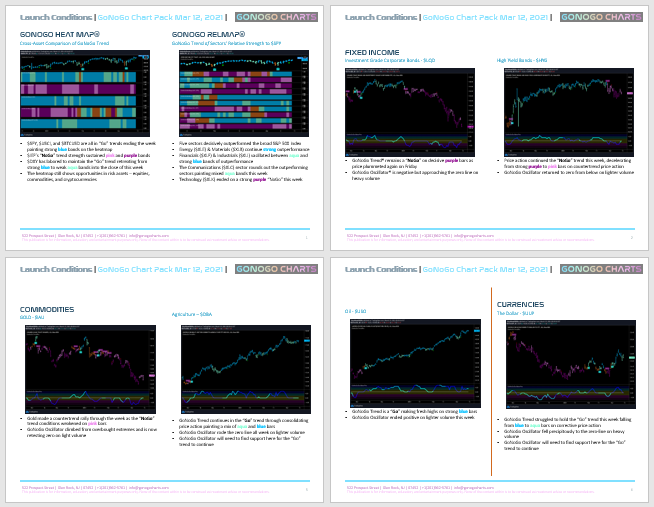
Welcome to your weekly review and long-term perspective on the markets. Click below to open your GoNoGo Launch Conditions 3-12
Equity Headwinds?
Amongst all the bullish evidence – “Go” trends resurging for risk assets and expanding market breadth – the US dollar chart is a peculiar outlier. As GoNoGo Research has noted for months, the “NoGo” trend in the dollar index through the end of 2020 aided and reinforced strong gains in equities and commodities. The recent choppy rally in US dollars has not forestalled the rise in commodities or domestic equities. Investors will note the strong correlation to emerging markets equity indexes such as $EEM which has fallen out of its meteoric “Go” trend.
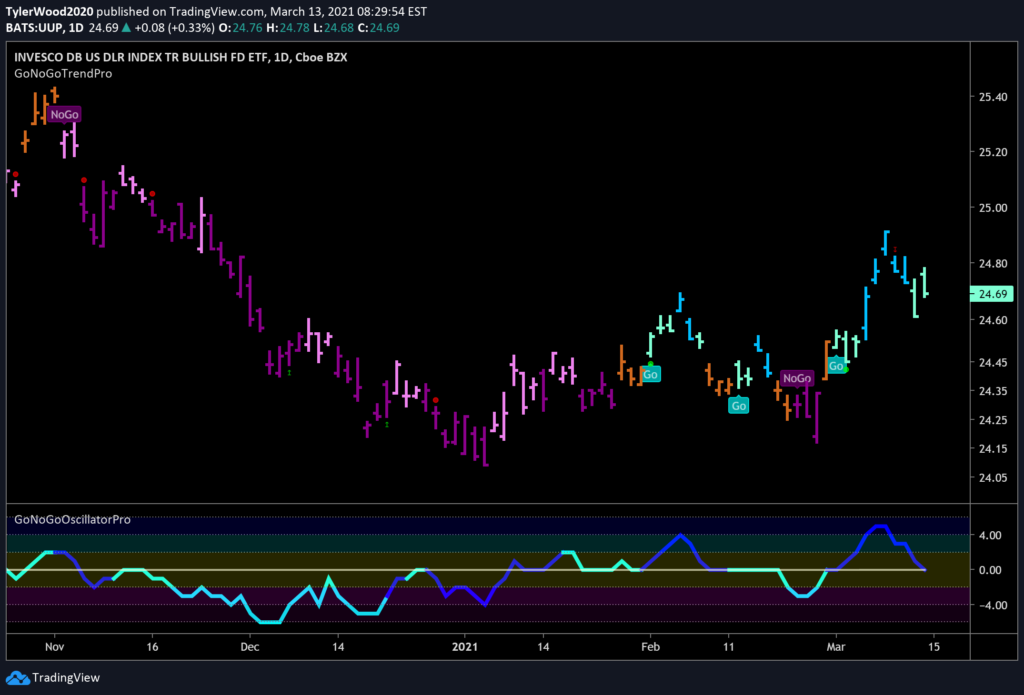
See the chart below of $UUP a US dollar index fund:

GoNoGo Trend struggled to hold the “Go” trend this week falling from blue to aqua bars on corrective price action. GoNoGo Oscillator fell precipitously to the zero-line on heavy volume.
GoNoGo Oscillator will need to find support here for the “Go” trend to continue. If it breaks down to negative territory, perhaps the Feb and Mar rallies were simply countertrend moves against the longer-term “NoGo?” GoNoGo Research will be watching closely for further evidence of a new trend.


