The consensus narrative to explain recent market volatility is as follows:
Markets were pushed and shoved by two groups of investors this week:
1.) Investors spooked by inflation risk.
2.) Investors bought the dip.
It is human nature to want a story. Merely looking at the data feels too sanitary and impersonal to many. However, watching 10yr Treasury Yields react to the core CPI numbers was much more helpful than any financial media newscaster. It is precisely our ability to stick to a rules-based process, take the weight of the evidence, watch “Price” is telling us, that will prevent us from taking an oversized loss or falling victim to the fear and greed that drive some investors to believe they know what will happen next.
This weekend, spend some time flipping through your Launch Conditions Chart Pack for the week ending May 14 and reacquaint yourself with the longer-term perspective Charles Dow favored so highly.
Implied Volatility
In case you missed it, the Labor Dept. reported that Core CPI (excluding food and energy) prices rose by 0.9% in April. This was the highest increase in nearly four decades and roughly triple consensus estimates. And, headline CPI rose 4.2% in the 12 months ending in April – one year after the Covid trough. Much ink has been spilled explaining the nature of the calculations, the appropriate adjustments for the effects of depressed numbers from last year: the “base effect”, and how transitory or structural the inflation numbers may actually be, etc… Inflation made it onto the cover of Barrons for anyone who’s interested in predictions/forecasts/conjecture about it all.
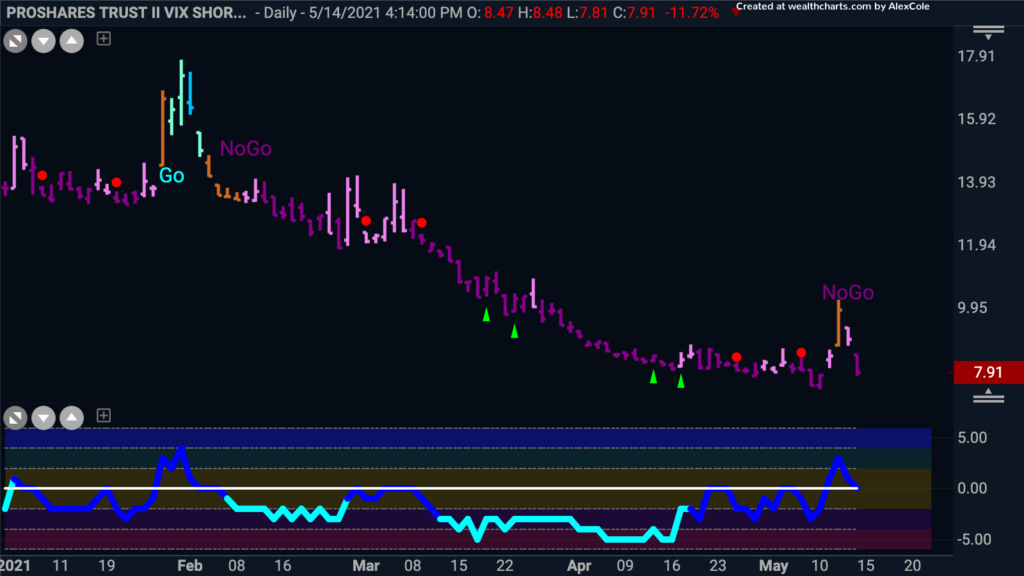
For the investor who cares about return more than thesis, let’s pay attention to fund flows rather than talk shows. The daily GoNoGo Chart of the $VIXY suggests that Wednesday’s reaction was fairly short-lived. GoNoGo Oscillator showed a positive spike in momentum before quickly retreating back to the zero line. The VIX itself approached 30, but never closed above 28 and was retreating sharply by Thursday and Friday.

US Equities Rebound, but finished lower
The stock market finished the week lower, with Dow and S&P both giving back roughly 1% from all-time record highs. But the sensation for many traders and investors was much more pronounced through the week. At its low point on Wednesday, the technology-heavy Nasdaq Composite index was down roughly 8.5% from its intraday April 29 peak. Both the Russell 2000 and Nasdaq Composite finished the week lower by more than 2%.
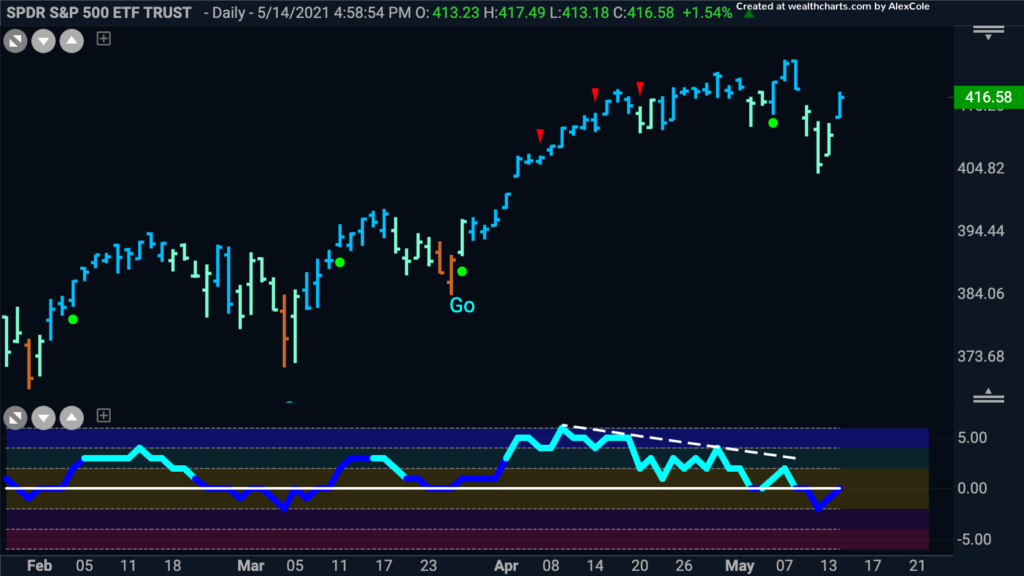
The Daily GoNoGo Chart below of the S&P500 shows the divergence building over the past few weeks between the lower highs in the oscillator not confirming the higher highs in Price ahead of the churn this week. We saw the oscillator slip into negative territory on higher volume, before returning to the zero line and regaining strong blue trend conditions to close the week.

What led the S&P lower?
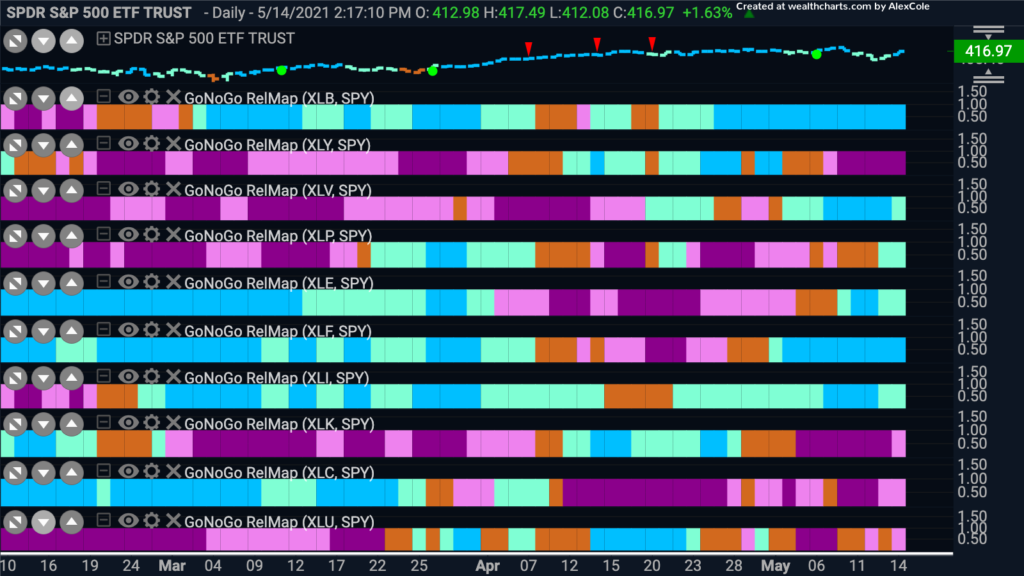
Importantly, the consumer discretionary sector $XLY was down 3.7% this week, Tech $XLK was down 2.2% and Communications $XLCwas down 2%. Many growth stocks are down substantially from their peaks in February. Their charts tell an extremely different story than the cyclical/value stocks which cooled or consolidated recent gains this week.
In the GoNoGo RelMap below you can see the relative performance of each sector against the S&P Index. Rotation themes and leadership from cyclical sectors are still clearly intact after this weeks chop. Consumer staples $XLP, financials $XLF and materials $XLB all closed the week higher on an absolute basis and their GoNoGo trends continue to lead the index on a relative basis:

As mentioned above, the US 10-yr Treasury yield increased from last Friday to end this week at 1.64%, and yet it settled below Wednesday’s 1.7% suggesting that the inflation risk which spooked the markets is less of a concern to the Fed who characterized this as the result of temporary dislocations caused by the pandemic.
No one can say with surety whether growth stocks will deliver sustained underperformance or remain out of favor, but for disciplined trend-followers, the charts tell the truth.


